
Share insight
insight
Amid rising student expectations and increasing demands on academics’ time, universities are grappling with how to create the space academics need to focus on their core mission of education and research. With competing responsibilities stretching the academic work week, university leaders are seeking clearer visibility of teaching effort and stronger evidence to guide decisions about workload, course design, and the shape of the taught portfolio.
Meaningful workload reform depends not just on local insights but on the ability to compare patterns of teaching effort across disciplines, schools, and peer institutions. One university that has taken significant steps forward in this space is Griffith University. Led by Provost Professor Liz Burd, Griffith launched its Making Space in the Work Week initiative, a whole of institution effort to diagnose the drivers of academic workload and create the conditions for more effective teaching and research and used Nous Data Insights’ Teaching Effort Analytics to validate insights, strengthen internal confidence, and accelerate its reform efforts.
Meaningful workload reform begins with understanding the real source of effort
Griffith’s Making Space initiative was launched in response to ongoing concerns amongst its academics about escalating workloads and administrative burden. These pressures were amplified by the shift to remote learning during COVID‑19, but continued as student expectations and technologies evolved, bringing requirements for new teaching modes, content and pedagogy.
With limited capacity to grow resourcing, Griffith set out to examine what was truly driving workload. For this, they needed reliable and robust data. The Making Space team surveyed academics to understand workload drivers such as time spent marking assessments and analysed how course structures and student numbers interacted with workload. This data provided the foundation for a more nuanced and actionable approach to workload reform.
From this work, four key drivers of workload emerged:
- The number of small courses
- The volume of classroom-based activities
- The number of assessment items
- Total contact hours per course
By focusing on these drivers, Griffith created a more nuanced and actionable understanding of where workload pressure was accumulating and where interventions could deliver the most impact to ease their academics’ concerns.
Griffith enabled academics with data to address the drivers of effort
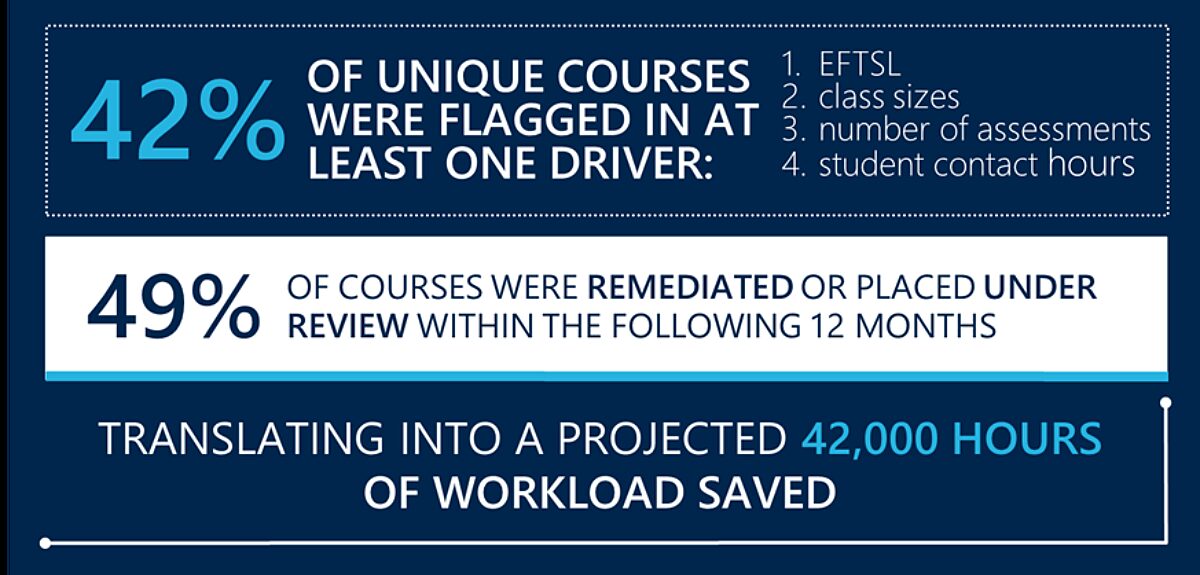
To translate the diagnostics into action, Griffith undertook a structured change process grounded in clear, university‑approved benchmarks. Each school received a detailed data pack summarising key workload drivers (equivalent full-time student load (EFTSL), class sizes, number of assessments, and student contact hours) alongside benchmark thresholds set by the University executive team. Course instances falling below these thresholds were flagged in a supplementary spreadsheet, prompting schools to either change them or provide a justified exception. Changes rarely meant discontinuing courses. Instead, most actions involved redesigning delivery to better align with benchmarks while maintaining high quality education, for example by adjusting class configurations, consolidating assessment tasks, or reconfiguring contact hours. This process gave schools a transparent, evidence‑based framework for reshaping academic workload.
The initial analysis provided clarity and measurable improvements. Overall, 42% of all unique course instances were flagged as exceeding the thresholds set for least one of the workload drivers, and some exceeded multiple drivers. Of those courses, 49% were changed or placed under review within the following 12 months, translating into a projected 42,000 hours of workload saved.
As more institutions look to free up academic time and enable staff to focus on their core mission of education and research, Griffith’s experience offers practical lessons for universities navigating similar pressures.
Local engagement is critical to driving improvement across the institution
While data provided the analytical foundation, Griffith recognised that meaningful improvement required genuine engagement across schools.
Leaders received detailed data packs containing course level flags and summaries highlighting areas where teaching effort exceeded expectations. Structured discussions enabled schools to review the evidence, explore drivers of variation, and agree on targeted actions or justified exceptions.
This approach, consistent in principle yet flexible in application, mirrors best practice across the sector. It ensured the process was not prescriptive or top down, but instead empowered academic leaders to evaluate teaching effort within their own disciplinary contexts.
Throughout, Griffith kept the student at the centre and worked closely with local academics and professional staff to consider impacts of excessive contact hours and assessment on students’ ability to complete their studies, and to develop multi-year transition plans to support students enrolled in programs and courses to complete their degrees.
Griffith tracked changes over two years, monitoring adjustments to assessments, course structures, and delivery modes. Visibility and iteration were central; data was used not to enforce compliance but to promote informed, transparent conversations about what mattered most.
Like many institutions, Griffith initially grappled with incomplete, inconsistent and messy data, requiring significant effort to assemble a reliable picture of teaching effort. The Making Space team worked closely with schools to validate and improve datasets, resolve gaps and inconsistencies, and develop bespoke solutions for complex issues such as co‑taught courses where system data did not reflect actual teaching arrangements. This sustained, hands‑on work built a deeper understanding of how teaching was structured across disciplines and resulted in clearer data pathways, stronger confidence in the information, and a suite of practical artefacts, including detailed data packs, tracking tools and visual summaries, that continue to support evidence‑based planning and decision making across the institution.
External benchmarking strengthens internal credibility and accelerates change
As the initiative progressed, Griffith adopted Nous Data Insights’ Teaching Effort Analytics (TE) to supplement and validate the internal analysis they had already completed. TE was valuable in confirming and highlighting the patterns Griffith had identified through their own early groundwork and providing a clear sector comparison point that strengthened internal credibility. Benchmarking showed that the trends emerging at Griffith aligned with those seen across peer institutions, helping overcome scepticism and giving leaders confidence that the issues they were addressing were not isolated anomalies.
Importantly, TE also highlighted where Griffith’s performance diverged from sector norms, helping leaders distinguish local issues from system‑wide pressures and sharpening the focus of subsequent conversations with academic units. While TE added significant value at this later stage, accelerating discussions, deepening insight, and strengthening the evidence base for decision making, its impact also underscored a counterfactual. Had Griffith had access to TE from the outset, much of the exploratory work required to identify the right workload metrics and analytical focus would have been faster, easier, and more precise. Provost Liz Burd reflected “This took us several years, and we went down a lot of rabbit holes. Using the NDI [Teaching Effort Analytics] method from the start would have shortcut that process down to months”.
Ultimately, Griffith’s experience demonstrates the power of a data‑led approach, and how tools like Teaching Effort Analytics can accelerate progress by making teaching effort visible and adding critical context through sector benchmarks.
Joining Teaching Effort Analytics enables universities to move faster and with greater confidence. By sharing sector‑wide insights and lessons learned, TE helps institutions avoid common pitfalls, accelerate reform, and progress more quickly towards sustainable academic workload models. Griffith’s experience demonstrates what becomes possible when strong leadership is supported by robust analytics and informed by proven practice across the sector.
By combining institution‑wide data with TE’s benchmarking and insights, universities gain the clarity and context needed to make teaching effort visible, prioritise high‑impact change, and create genuine space for academics to focus on what matters most: teaching, research, and supporting student success.
If you would like to explore the issues and approaches covered in this article and discuss how Teaching Effort Analytics can improve your institution’s priorities around teaching resource management, please contact us.