Share insight


insight
Teaching reform can work better for staff and students when evidence is built in early
Canadian universities are under pressure to improve student outcomes while making academic workloads more sustainable. That pressure is turning choices about program and course mix, teaching quality, staffing and portfolio design into core leadership decisions. These choices shape students’ learning experience and determine whether academics are asked to absorb more work, work differently, or redirect effort toward the activities that matter most.
In this environment, it can be tempting for academic leaders to begin reform with the evidence available at a single department or faculty level, and strengthen the data later. That instinct is understandable when reform timelines are tight, student needs are immediate and academic workload pressures are mounting. But decisions based on only part of the picture create their own risks. They can leave institutions without a shared view of the problem they are trying to solve, the trade-offs they are making, or the impact of changes once they begin.
The better approach is not to wait for perfect data. It is to build a credible baseline that can guide decisions, test assumptions and improve over time, while keeping student experience and academic workload sustainability visible. Teaching effort is a practical place to begin because it connects across academic workload, teaching delivery, workforce planning, portfolio decisions and student outcomes. Used well, that evidence can help conversations about teaching reform move from broad concern about workload pressure and student outcomes to a clearer view of what is driving effort and where change is most likely to help both students and staff.
A sector still building the evidence base to enable teaching reform
Despite broad recognition of the importance of data-informed decision-making, many universities still have limited visibility of how academic effort is distributed and what drives it. At a recent Nous Data Insights executive roundtable for Australian and New Zealand universities, two-thirds of senior leaders rated the maturity of their data capability in this area as “relatively low”. Many described data that was fragmented across schools, shaped by local workload models, or visible only through partial central reporting.
Canadian universities face a similar challenge at a time when teaching reform is moving higher on the leadership agenda. Many are asking how to reduce duplication, rebalance workloads, reshape teaching models, improve student outcomes and make better use of constrained academic capacity. These questions cannot be answered well if the evidence base is assembled only after reform priorities have already been set.
The risk is not that every dataset is imperfect, it is that teaching reform proceeds from assumptions and anecdotes that remain largely unqualified. Without a transparent institutional baseline, priorities can be set before the true problem is well understood, initial assumptions about workload or demand can become embedded in reform design, and trade-offs become harder to explain and defend.
Seen this way, evidence is not a reporting layer to add once decisions have been made. It is essential infrastructure reform decisions need from the start: a way to define the current state, make trade-offs visible, and test whether change is having the intended effect.
What becomes visible when teaching effort is analysed early
We have found that teaching effort is a useful evidence base because it brings together questions that are often considered separately: what is being taught, how many students are being taught, who is teaching them, how workload is allocated, and what delivery model the institution is sustaining. When these datasets are linked, universities can move beyond broad statements about workload pressure and identify specific drivers of effort.
That is where the opportunity becomes more concrete. Analysis can reveal where small cohorts, assessment intensity, delivery mode, staffing mix, portfolio size or local workload rules are contributing to high-effort teaching. It can also show when apparent workload pressure is not driven by an obvious cause, or when similar student loads require very different levels of academic effort. These patterns are very difficult to see from enrolment, staffing or financial data alone.
Peer comparison makes this analysis more useful because it helps leaders distinguish what is distinctive about their institution from what reflects broader disciplinary patterns across universities. Internal data can show where activity is concentrated; benchmarking helps test whether those patterns are unusual, material and addressable.
In our work, two areas often stand out: the breadth of the teaching portfolio and the design of assessment.
The size and shape of the teaching portfolio is one material driver of teaching effort. Comparisons from our Teaching Effort Analytics program between UK and Australian universities show that UK portfolios can be as much as double the size of Australian universities at first-year level. Larger or more fragmented portfolios create effort that is often hidden in headline student-load or staffing measures: more small cohorts, more coordination, more assessment design, more governance and more local variation in delivery. Portfolio size is therefore not just a curriculum architecture or cost issue; it directly affects teaching effort, workload sustainability, student experience and progression.
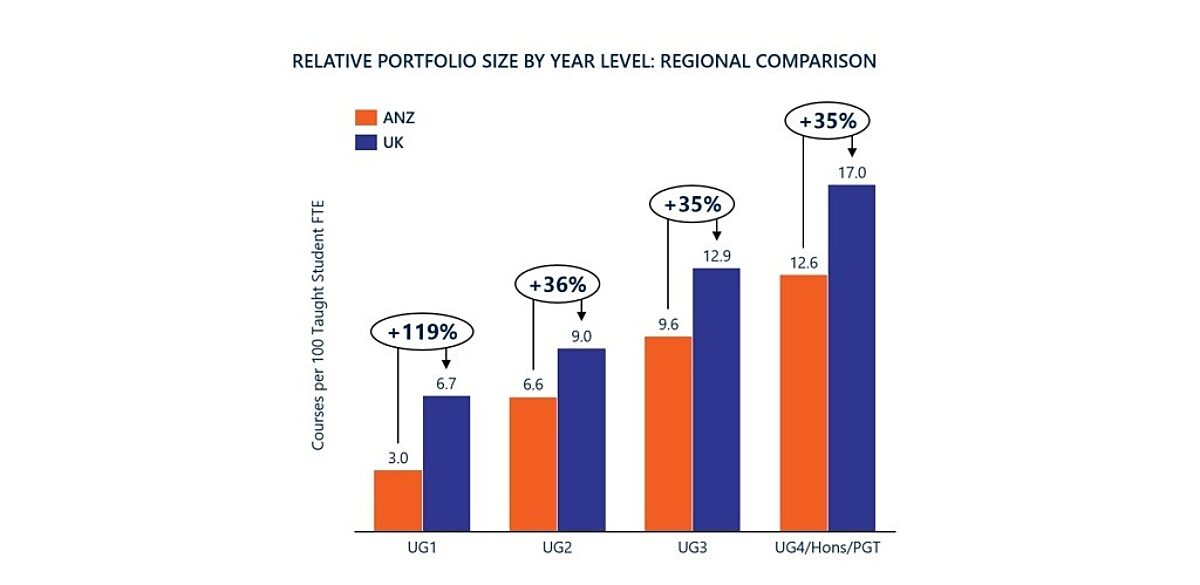
Canadian universities often struggle with the need to be all things to all people while also demonstrating excellence in a few disciplines. Having the data to understand the trade-offs that come with a broad (or narrow) course portfolio enriches campus conversations on which path is appropriate for each institution.
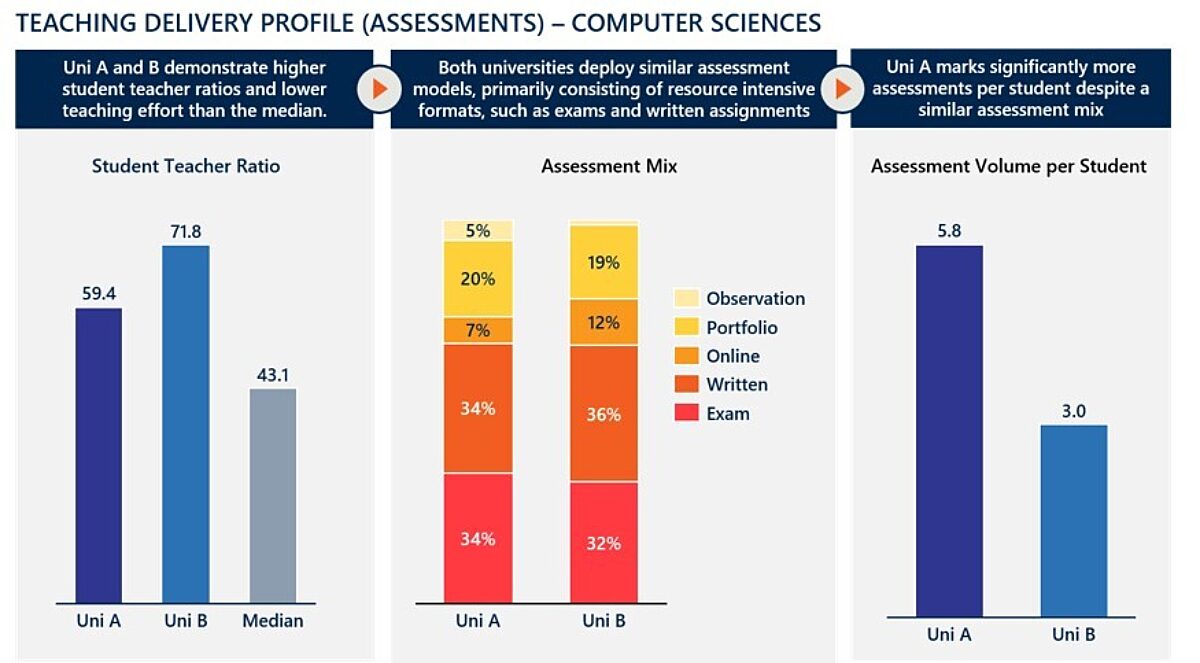
Assessment volume is another example of the insights visible in teaching effort analysis. The diagram below compares two universities in the same discipline with a broadly similar assessment mix, but very different assessment volumes. The university with more assessment tasks also shows higher teaching effort, because each additional task brings work in design, student support, extensions, integrity management, marking, moderation and feedback. When that volume is higher than needed to deliver the subject learning outcomes, it can create avoidable demand for academics and make the learning experience more fragmented and challenging for students.
The practical value of making these drivers visible can be significant. One university used teaching-effort data to inform its internal reform program and work with academics on reducing unnecessary effort across several dimensions, including small classes, assessment volume, contact hours and program complexity. The work released academic time for higher-value activity, while improving the student experience through simpler program structures, more manageable assessment loads, easier timetabling and fewer student enquiries.
The university’s data was not perfect, instead it had sufficient shared evidence early enough to focus reform planning on trade-offs, risks and opportunities rather than competing local narratives. That is the practical standard universities should be aiming for: a baseline that is credible, transparent about assumptions and useful from the outset before unqualified reform choices become difficult to change.
From reform ambition to evidence-led decisions
When teaching, workload and student data are brought together early, universities gain a practical baseline for decisions they already need to make. That baseline helps leaders ask sharper questions:
- Where is teaching effort concentrated, and what is driving it?
- Which parts of the portfolio are structurally high-effort relative to their student load or strategic value?
- Where are workload pressures institution-specific, and where do they reflect broader sector patterns?
- How much capacity could realistically be redirected or reinvested?
- Am I confident our teaching reform has improved workload sustainability, student outcomes and academic experience?
These questions sit at the centre of teaching reform because they determine where scarce academic time is being used, which pressures are structural rather than anecdotal, and which trade-offs leaders can justify. Without that evidence, reform can become a contest between local narratives. With it, academic leaders can focus attention on the choices most likely to improve workload sustainability, student experience and outcomes.
Through Teaching Effort Analytics, we are helping leaders turn workload, teaching and student data into a credible baseline for reform, clarifying where effort is going, what is driving it, and where change is most likely to improve outcomes. If your university is considering teaching, workload or portfolio reform, we would welcome a conversation about what your current data can already tell you, what evidence you may need next, and how quickly a decision-useful baseline could be built.
Authors

Adam Gray
CEO
Adam is an expert in strategy, transformation, and operational performance and one of Australia’s leading higher education consultants. He is a trusted advisor to many leading universities.


Haseeb Kamal
Managing Director, North America
Haseeb has spent over 10 years advising clients in the education sector, spanning K-12 and higher education.